Parsing and Plotting Captures
The start_trial script described here copies 8 packet capture (pcap) files to a local ‘Results’ directory. This page describes the tools used to parse these captures and create plots of the goodput (throughput seen by the receiver), the round trip times (for the sender) and the packets in flight (for the sender).
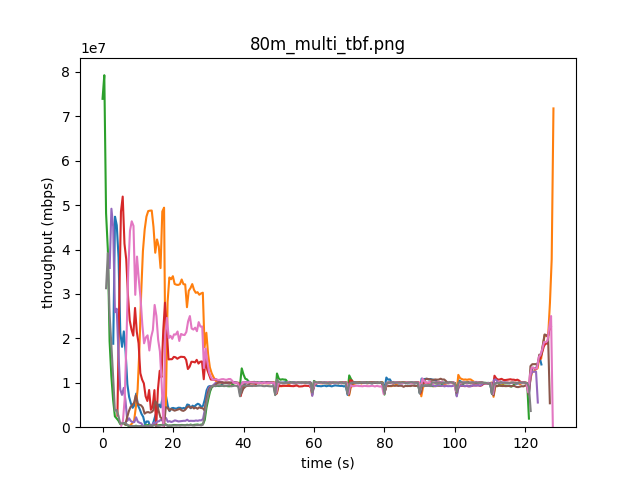
The goal is to parse each experiment, the 8 pcap files, into 8 csv files, and then to create plot like this:
Parsing
To do this, each flow identified by the (src port, src ip, dest port, dest ip) tuple, must parsed into a csv file containing the throughput, round trip time, and packets in flight as seen by each raspberry pi at some granularity (usually half a second).
This parsing is done using a rust program developed here. This program parses each of the captures matching a given regex pattern and for each program, creates a csv file for each flow identified. This csv file with contain each of the Parser Entries defined in parse_pcap.rs. Currently, this includes the rtt, throughput, and packets in flight.
The round trip time for each half second is calculated by dividing the time for each of the packets ack’d in that window by the number of packets ack’d. If there are no packets ack’d in a given half second window, the round trip time is whatever the previous time was + the granularity of the window (half a second).
The throughput it calculated as the number of packets sent in each half second window.
The packets in flight is the number of bytes un-acked at the end of each window.
The output is a csv file for each flow, which may look something like this: (note: the granularity for this csv is 10 milliseconds, not 500)
time,throughput,inflight,rtt
59437,19200000,94120,40
59447,19200000,92672,40
59457,24000000,101360,40
59467,24000000,105704,40
59477,25200000,112944,40
59487,24000000,118736,40
59497,25200000,121632,40
Plotting
Once the data is parsed into csvs, it can easily be plotted using python. The script we use to create the plot show above is here
The round trip time and packets in flight are calculated from the “senders’” point of view, whereas the throughput (or goodput) is calculated from the “receivers”’ point of view.
Summary
Given the captures for each raspberry pi are stored in a directory, the command below can be used to generate the plots.
rm *.csv; RUST_BACKTRACE=1 cargo run '*' ~/temp/
python3 plot.py . . new.png show
rm *.csv; cargo run <file_regex_pattern> <directory>
python plot.py <input directory> <substring to match> <output_name> <show>